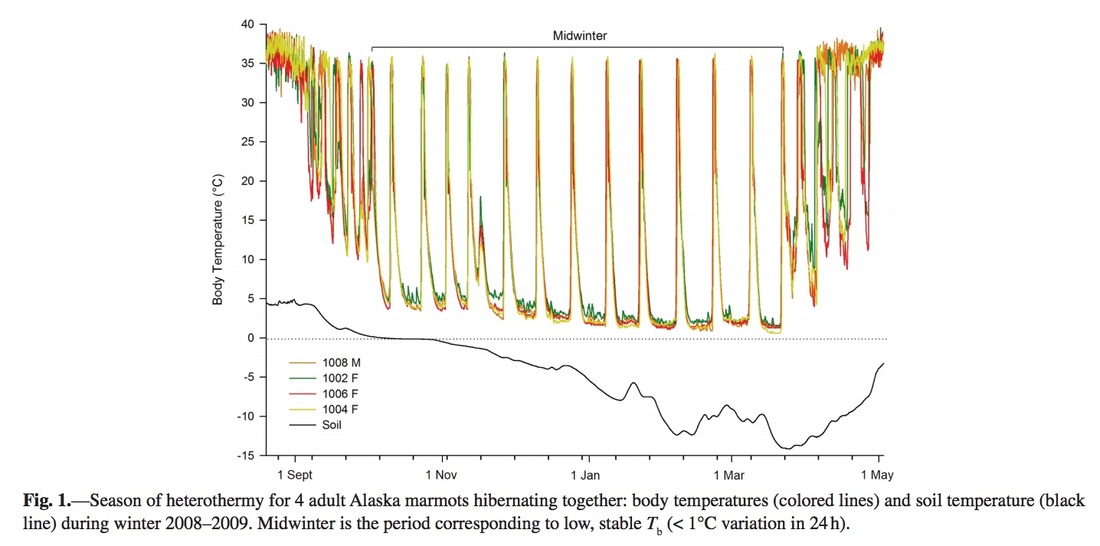
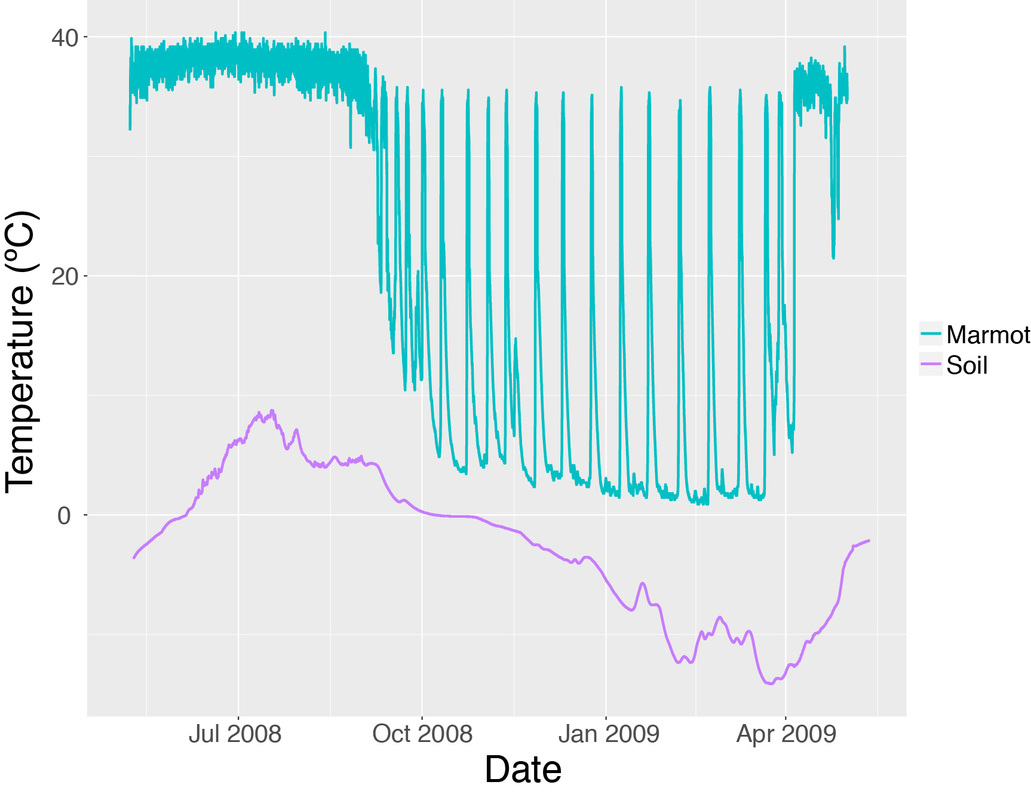
Earlier today I helped make a figure for a proposal about marmot hibernation patterns. The goal was to make a figure similar to Figure 1 in Lee et al. 2016 (J. Mamm.), which shows the body temperatures of four marmots as well as the temperature of the soil in their burrow:
I was working with a 3-column dataset in tab-delimited (.txt) format that looked like this:
Date.Time Temp Label
5-9-2008 14:04 -3.67 soil
5-9-2008 14:44 -3.64 soil
5-9-2008 15:24 -3.61 soil
...
5-2-2009 14:36 37.23 marmot
5-2-2009 14:56 37.23 marmot
5-2-2009 15:16 36.12 marmot
The following code is my attempt to replicate the figure above using ggplot2 in R:
#load the ggplot2 library
library(ggplot2)
#import the data file
Data <- read.delim("~/Desktop/Marmots_and_Soil_Data.txt")
#define the format of our Date.Time column
Data$Date.Time<-strptime(Data$Date.Time, format= "%m-%d-%Y %H:%M")
#convert the Date.Time column to a format that ggplot2 can read
Data$Date.Time<-as.POSIXct(Data$Date.Time)
#plot the data
ggplot(data=Data, aes(x=Date.Time, y=Temp, group=Label, colour=Label)) +
geom_line(size=1) +
ylab("Temperature (ºC)") +
xlab("Date")


 RSS Feed
