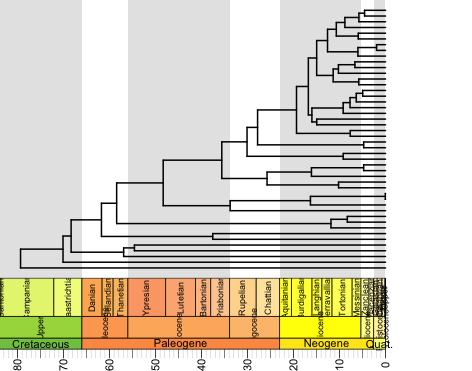
You'll need two packages: phyloch (if you're reading in a BEAST tree) and strap. Note that phyloch is not available in CRAN and must be downloaded from the author's website. Here's the R code for making this pretty tree:
library(phyloch)
library(strap)
library(OutbreakTools)
t <- read.annotated.nexus("myBeastTree.tre")
t$root.time <- t$root.annotation$height
geoscalePhylo(tree=ladderize(t,right=FALSE), units=c("Period", "Epoch", "Age"), boxes="Epoch", +cex.tip=0.5, cex.age=0.7, cex.ts=0.7, label.offset=0, x.lim=c(-15,80), lwd=3, width=2)
###
This command is really flexible. "units" allows you to select whether or not to show Periods, Epochs, Ages, Eons, or a user-defined timescale. "boxes" allows you to pick which unit to plot gray boxes on. "width" controls the thickness of the branches. "x.lim" controls the year span. Yes, I know that the labels are squished on the time axis, but you can adjust those.
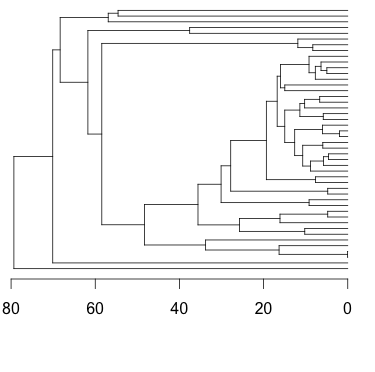
Compare this to a tree made with the simple plot command:
plot(t, show.tip.label=F)
axisPhylo()


 RSS Feed
